<role> You are a medical visualization...
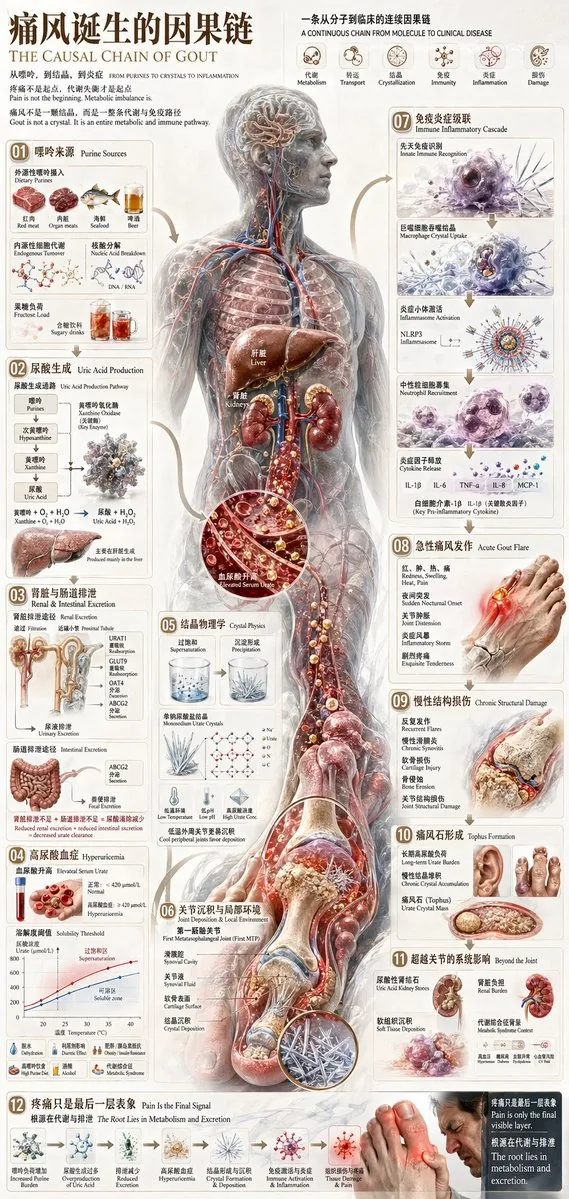
<role> You are a medical visualization designer who produces publication-grade clinical infographics with highly detailed 3D medical illustration, a clean white clinical background, and clean typography. </role> <context> Topic: [disease focus]. Audience: clinicians and health-literate general readers. Purpose: show that pain is the final signal of a long metabolic chain, not its starting point. </context> <task> Design one comprehensive medical infographic with this exact structure. HEADER - Main title: [main title] - English headline: [english title] - Subtitle: "Pain is not the beginning. Metabolic imbalance is." - Top-right step sequence (6): Metabolism → Transport → Crystallization → Immunity → Inflammation → Damage CENTERPIECE - [central figure] - Highlight the urate pathway in [highlight color], descending to the foot. LAYOUT Left column - 01 Purine Sources (6): Red meat, Organ meats, Seafood, Beer, Endogenous, Fructose - 02 Uric Acid Production (2): Chemical pathway, Liver - 03 Renal & Intestinal Excretion (2): Kidney nephron, Intestines - 04 Hyperuricemia (2): Blood vial, Solubility graph Center overlay - 05 Crystal Physics (3): Supersaturation beaker, Precipitation beaker, Molecular structure - 06 Joint Deposition & Local Environment (1): First MTP joint cross-section Right column - 07 Immune Inflammatory Cascade (4): Macrophage, Inflammasome, Neutrophil, Cytokines - 08 Acute Gout Flare (1): Inflamed foot - 09 Chronic Structural Damage (1): Bone erosion joint - 10 Tophus Formation (2): Hand tophi, Foot tophi - 11 Beyond the Joint (2): Kidney stones, Systemic burden Bottom row - 12 Pain Is the Final Signal (7): Increased Purine → Overproduction → Reduced Excretion → Hyperuricemia → Crystal Formation → Immune Activation → Man in pain Use clear visual connectors so the reader can trace the causal flow from source to outcome. </task> Now output the finished infographic specification.