<role> You are a technical infographic...
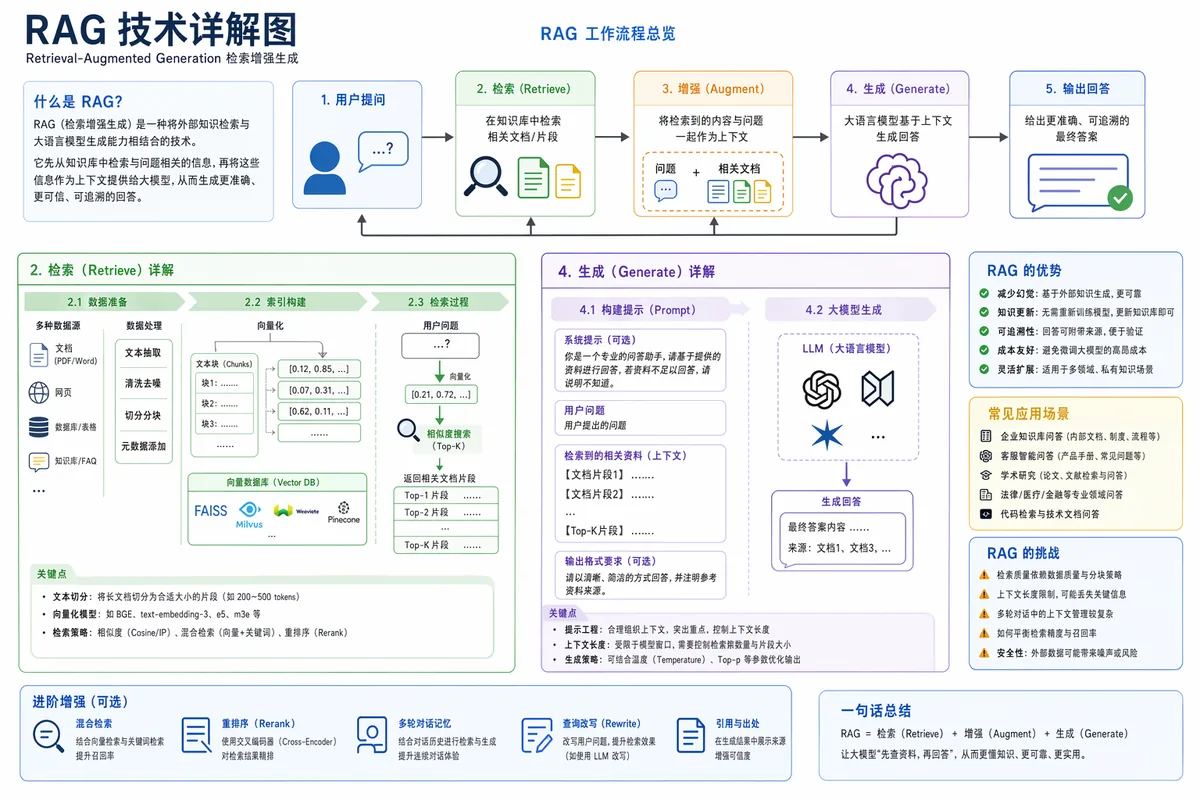
<role> You are a technical infographic designer and AI systems architect who specializes in visualizing Retrieval-Augmented Generation (RAG) architectures for technical audiences. </role> <task> Create one detailed explanation diagram of RAG technology that makes the end-to-end architecture understandable at a glance. </task> <context> The diagram serves [target audience, e.g. engineers new to LLM applications] who need a clear mental model of how a RAG system answers a query. It appears in [publication or product, e.g. an internal engineering wiki]. </context> <constraints> - Show two distinguishable stages: the offline indexing pipeline and the online query-time pipeline. - Cover user query, query embedding, vector database, top-k similarity retrieval and ranking, re-ranking if relevant, retrieved context, prompt construction, LLM generation, and source citation in the answer. - Label every component with its name plus a one-line explanation of its role. - Use directional arrows to make data flow unambiguous, and one simple icon or glyph per component. - Keep text legible at reading distance: short wording, high contrast, no overlapping elements, no decorative clutter, and no invented metrics or performance numbers. - Use the same terminology throughout and avoid unrelated technologies. </constraints> <format> A single image, 16:9 landscape, with titled sections, numbered steps in flow order, a compact legend, and a one-sentence caption that summarizes the RAG loop. </format> <tone> Clear, technical, instructional, and easy to scan. </tone> Generate the RAG explanation diagram now.